The goal of the DEBS 2012 Grand Challenge is to provide a
common ground and evaluation criteria for a competition aimed at both research
and industrial event-based systems. The goal of the competition is to implement
a solution to a problem provided by the DEBS 2012 Grand Challenge organizers.
Solutions provided by the challenge participants will be evaluated and rated
based on the following criteria: (1) correctness with respect to the problem
specification, (2) throughput, and (3) latency.
Authors of all accepted submissions will be invited to
present their systems during the DEBS 2012 Conference. All accepted submissions
are to be accompanied by a paper, which will be included in the conference
proceedings. Challenge papers must be in the ACM format for the conference
proceedings and are limited to 3-6 pages. Upon the explicit consent from the
challenge participants their solutions will be included in the global ranking
with the winner of the challenge being announced and awarded during the
banquet.
Problem Description
The DEBS 2012 Grand Challenge problem involves monitoring of large hi-tech manufacturing equipment. The overall goal of the challenge is to demonstrate the capability of the event processing system to solve the set of queries for the given data. Therefore, the problem description is divided into two major parts – the description of the available data and the description of the queries which need to be executed on the data in order to solve the problem.
Data
The complete data set for the DEBS Challenge is available via FTP: ftp://ftp.mi.fu-berlin.de/pub/debs2012/ or ftp://ftp.fu-berlin.de/science/computer/debs2012/ (mirror). The directory contains both the data file and the MD5 sum.
Monitoring data is recorded by the manufacturing equipment itself using an embedded PC and a set of sensors. The data is recorded with 100Hz frequency. However, it is possible that the time between two consecutive data points differs significantly from 10ms. The data is available as a flat CSV file, with each line representing a single event (data point). For the convenience of the DEBS Grand Challenge participants we have provided a data generator. The data generator is a simple runnable 32-bit JAR file which consumes the CSV data file and puts its contents into events which are subsequently sent via TCP/IP to a scpecified destination address. The generator JAR file can be downloaded from this link. The generator outputs (serializes) events in Google Protocol Buffers format. We also provide source code for a very simple server capable of receiving the messages output by the generator. The schema of output events is the following:
message CDataPoint {
required fixed64 ts = 1; //time stamp: nanoseconds since 1st Jan 1970
required fixed64 index = 2; //message index
required fixed32 mf01 = 3; //Electrical Power Main Phase 1
required fixed32 mf02 = 4; //Electrical Power Main Phase 2
required fixed32 mf03 = 5; //Electrical Power Main Phase 3
required fixed32 pc13 = 6; //Anode Current Drop Detection Cell 1
required fixed32 pc14 = 7; //Anode Current Drop Detection Cell 2
required fixed32 pc15 = 8; //Anode Current Drop Detection Cell 3
required uint32 pc25 = 9; //Anode Voltage Drop Detection Cell 1
required uint32 pc26 = 10; //Anode Voltage Drop Detection Cell 2
required uint32 pc27 = 11; //Anode Voltage Drop Detection Cell 3
required uint32 res = 12;
required bool bm05 = 13; //Chem A Additive Sense
required bool bm06 = 14; //Chem B Additive Sense
required bool bm07 = 15; //Chem C Additive Sense
required bool bm08 = 16; //Chem A Additive Release Valve VL26
required bool bm09 = 17; //Chem B Additive Release Valve VL27
required bool bm10 = 18; //Chem C Additive Release Valve VL28
optional bool pp01 = 19;
optional bool pp02 = 20;
optional bool pp03 = 21;
optional bool pp04 = 22;
optional bool pp05 = 23;
optional bool pp06 = 24;
optional bool pp07 = 25;
optional bool pp08 = 26;
optional bool pp09 = 27;
optional bool pp10 = 28;
optional bool pp11 = 29;
optional bool pp12 = 30;
optional bool pp13 = 31;
optional bool pp14 = 32;
optional bool pp15 = 33;
optional bool pp16 = 34;
optional bool pp17 = 35;
optional bool pp18 = 36;
optional bool pp19 = 37;
optional bool pp20 = 38;
optional bool pp21 = 39;
optional bool pp22 = 40;
optional bool pp23 = 41;
optional bool pp24 = 42;
optional bool pp25 = 43;
optional bool pp26 = 44;
optional bool pp27 = 45;
optional bool pp28 = 46;
optional bool pp29 = 47;
optional bool pp30 = 48;
optional bool pp31 = 49;
optional bool pp32 = 50;
optional bool pp33 = 51;
optional bool pp34 = 52;
optional bool pp35 = 53;
optional bool pp36 = 54;
optional bool pc01 = 55;
optional bool pc02 = 56;
optional bool pc03 = 57;
optional bool pc04 = 58;
optional bool pc05 = 59;
optional bool pc06 = 60;
optional bool pc19 = 61;
optional bool pc20 = 62;
optional bool pc21 = 63;
optional bool pc22 = 64;
optional bool pc23 = 65;
optional bool pc24 = 66;
}
The only difference between the event schema output by the generator and the event schema in the CSV file is that for the generator output the time stamp format is converted from the ISO-like representation into the UNIX-like representation – seethe above schema definition. In order to run the generator a following command has to be issued:
$ java -jar generator.jar "/path/to/data/file.dat" 1.0 localhost 8080
Where “./path/to/data/file.dat” is the path to the data file, 1.0 is the speedup factor for the data generation, localhost is the name or the IP address of the destination host, and 8080 is the port number on the destination host. One feature of the generator is that it outputs events preserving their relative occurrence time. This means that the input file is replayed at (almost) the same speed at which the original data was recorded. The replay speed can be influenced by modifying the speedup factor. Specifying a value greater than 1.0 implies a replay speed which is higher than the original data rate while specifying a values below 1.0 implies a replay speed lower than the original data rate.
We are still in process of gathering of the data. However, in order to allow Challange participants to develop their solutions we provide a small data file contaning 5 minutes worth of samples. Please use the link to access the file.
Queries
Within this section we describe the queries which are part of the DEBS 2012 Grand Challenge. In our description we assume that all queries operate on the same event schema as defined above. We describe every query using a block data flow diagram with white rectangles representing operators and gray rectangles representing event streams.
Query 1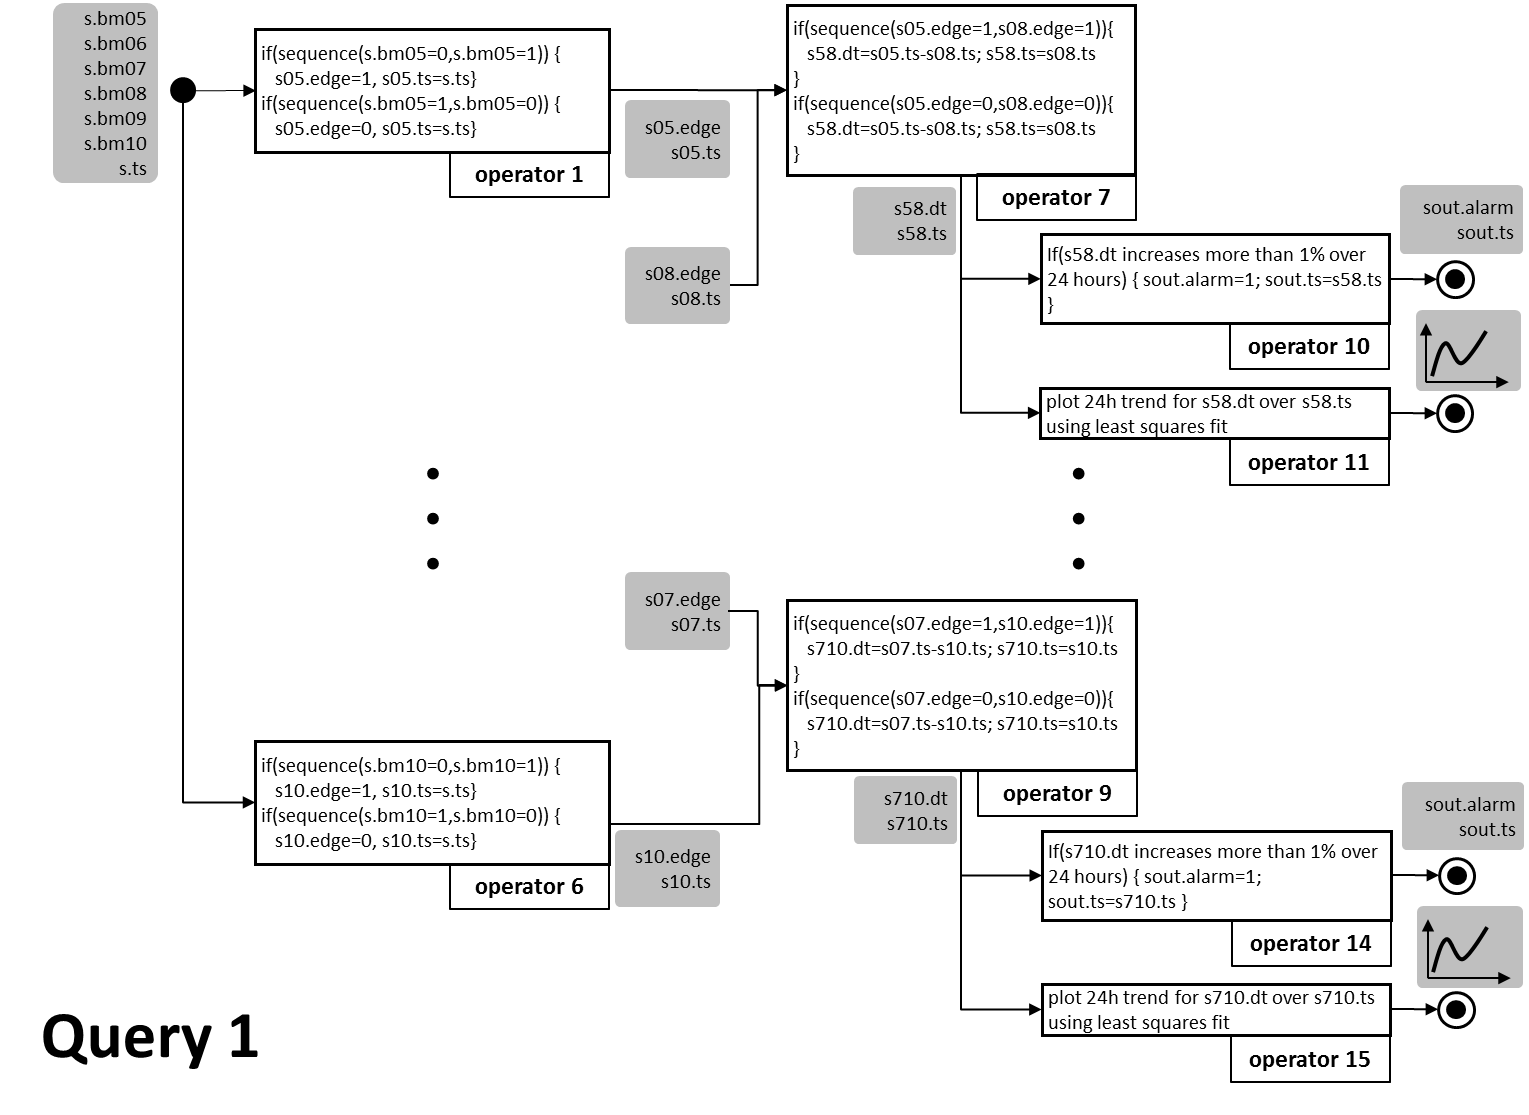
The goal of the first query is to monitor the behavior of Chem Additive sensors which themselves are responsible for the monitoring of Chem Additive Release valves – see Figure above. As all input data in this task is boolean the first operation performed by the operators 1 till 6 is to detect the change of state of each input fields (bm05 till bm10) and emit those along with time stamps of the state change occurrence. The second set of operators (7 till 9) correlates the change of state of the sensor and the change of state of the valve by calculating the time difference between the occurrence of the state changes. Whenever, the time difference increases by more than 1% within a 24hour period an alarm has to be raised. Moreover, a constant monitoring of the trend for the time difference using the least squares method for the period of 24 hours has to be performed. The trend monitoring can be either visualized or returned as a stream of plot parameters.
Query 2
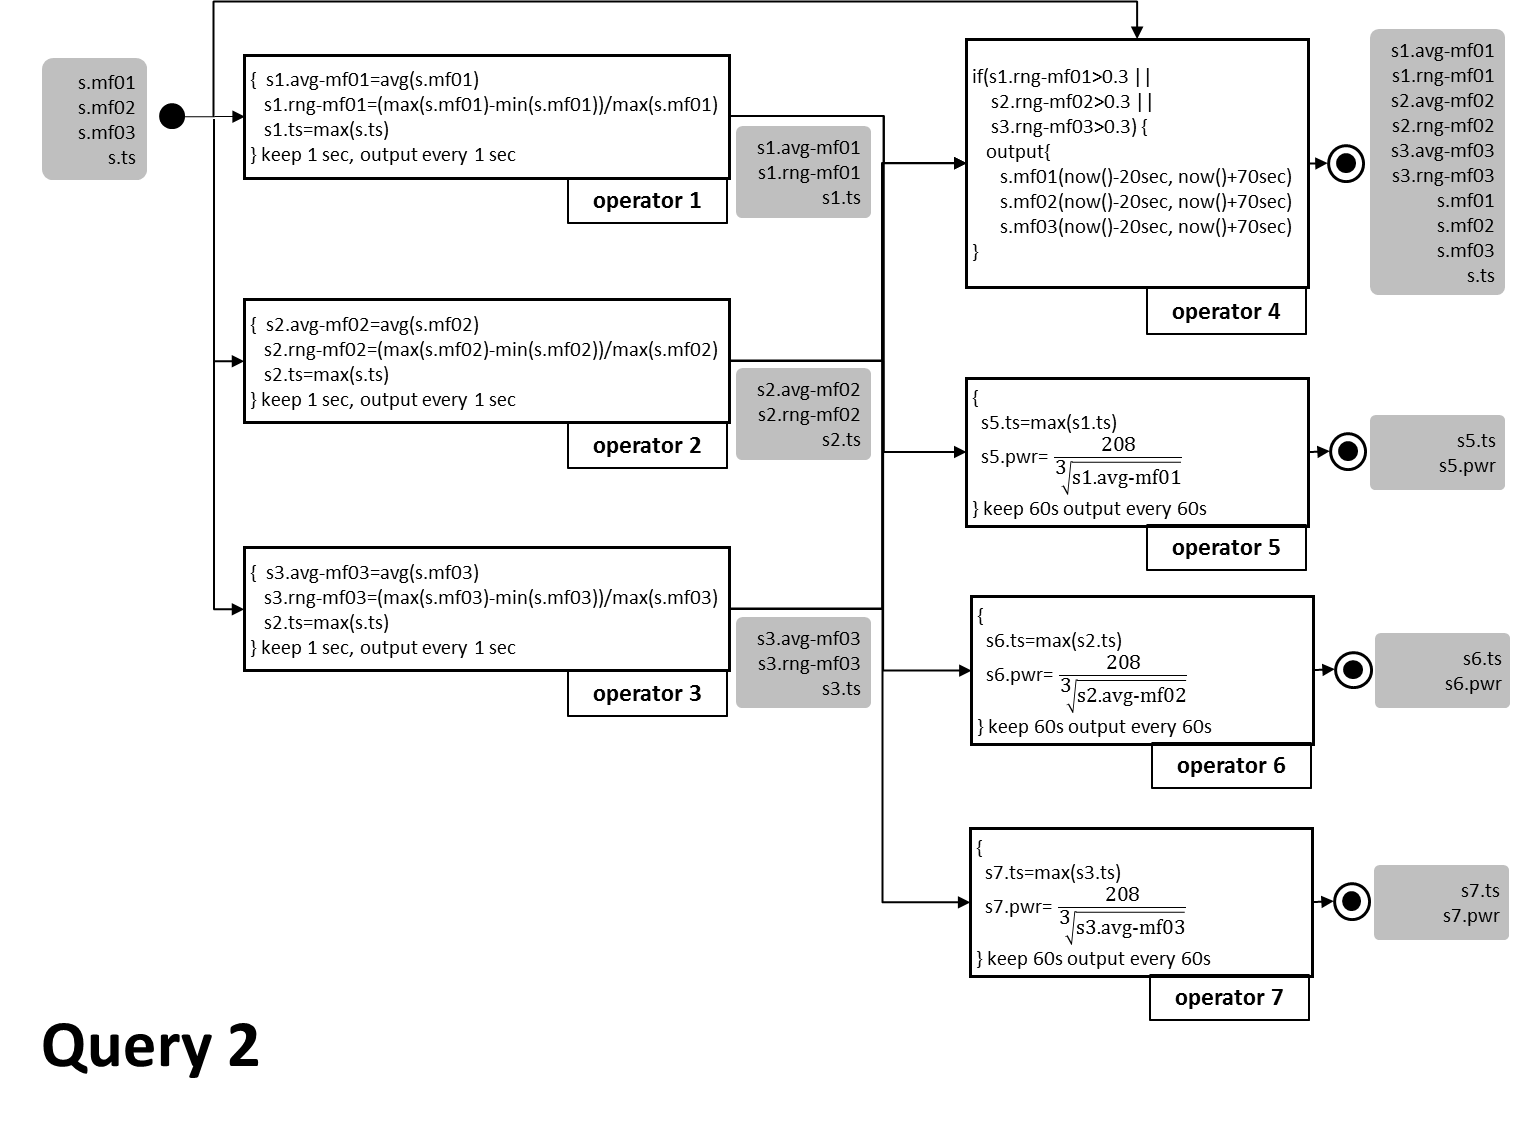
The goal of the second query is to monitor the energy consumption of the manufacturing equipment. The energy consumption is recorded by the sensors mf01, mf02, and mf03. The first set of operators (operator 1 till 3) calculates the average values for each of the sensors (s1.avg-mf01 till s1.avg-mf03) as well as the relative variation (s1.rng-mf01 till s1.rng-mf03) in each of the sensors readings. Both average and variation values are calculated over the period of 1 second and are output every second.
The relative variation is used to trigger the recording of the raw values of the sensor readings — see operator 4. Whenever the relative variation on any of the energy measuring sensors exceeds the threshold of 30%, the raw data from each of the sensors (mf01-mf03) needs to be recorded starting 20 seconds before the occurrence of the threshold violation and ending 70 seconds afterwards. If multiple violations occur with the 90 second interval, it needs to be extended so that it always captures 70 seconds of raw data after the occurrence of the last violation and 20 seconds before the occurrence of the first violation.
Finally, operators 5 till 7 record the power consumption of the manufacturing equipment within a period of one minute.
Q&A
Question: In Query 1 – should we assume that the initial values of bm05, …, bm10 are 0, 1, or unknown?
Answer: The initial values are either 0 or 1. However, it is not know a priori whether it is 0 or 1.
Question: How are GPB messages written to the socket?
Answer: Messages are written using an encoder that prepends the Google Protocol Buffers messages with Base 128 Varints integer length field. Please refer to the sample server source code for the detailed insight into the decoding of the messages.
Question: Query 1 – is the 24h trend containing just the values of the last 24 hours or is it a prediction for the next 24 hours?
Answer: It contains last 24 hours.
Question: Query 1 – which kind of function should be used for the method of least squares: a simple linear or a non-linear like quadratic or polynomial?
Answer: Simple linear.
Question: Query 1 – when should the trend plot be updated?
Answer: Whenever the trend values change.
Question: Query 2 – What is the meaning of “now()” – is it the system time like “System.currentTimeMillis ()” in Java or is it the timestamp of the event (sensor reading) that causes the violation?
Answer: It is the timestamp of the sensor reading that caused the violation.
Question: Some lines in the input file seem to be merged (missing “\n”). See lines: 36000, 71999, 719998, 7319680, 18453793, 22725937, 28247589, 28473136, 28880898, 29077791, 29287746, 31847342.
Answer: Yes, this is a bug! We will fix it and upload a new file.
Question: Question 1 – “Whenever the time difference increases by more than 1% within a 24h period, an alarm has to be raised.” How should this 24h period be treated?
Answer: Using the operator 10 as an example – you should collect 24 hours’ worth of s58.dt and check whether the difference between any two values of s58.dt in the 24h window exceeds 1%. The window slides by removing tuples whose s58.ts < max(s58.ts) – 24h.